What is EMA, Exponential Moving Average, EMA Crossover Strategy, Best EMA for Intraday Trading, EMA Strategy for Beginners, 200 EMA Trading Strategy, EMA vs SMA
Exponential Moving Average
Exponential Moving Average (EMA) is one of the fundamental indicators in technical analysis used by traders to detect trends in markets, such as the stock market and cryptocurrency market, assess momentum, and improve trading strategies. EMA, unlike the Simple Moving Average (SMA), places a greater emphasis on recent price information, which makes it a flexible tool for traders. In this detailed guide, we will delve into EMA’s role in the stock market, how to calculate it, and how to use EMA effectively in your stock trading journey.
What is EMA?
The Exponential Moving Average (EMA) is another moving average that gives more weight to recent price data, and thus, responds more adeptly to current market behaviour. This enables traders to adjust quickly in case of price changes while also better forecasting future price behaviour. EMA indicator in trading stands for:
- Spotting trends in price action.
- Offer live support and resistance levels.
- Identifying entry and exit opportunities.
Why is EMA Important in Technical Analysis?
EMA is a vital tool in technical analysis as it reacts quickly to recent price fluctuations. Its applications include:
- Trend Identification: EMA is used by traders to identify the market trend. An increasing EMA shows an uptrend and a decreasing EMA indicates a downtrend.
- Dynamic Support & Resistance: EMAs serve as dynamic support or resistance levels that traders can reference when the market is moving.
- EMA Trading Strategies: These patterns can be applied for Intraday, Swing and Positional trading setups.
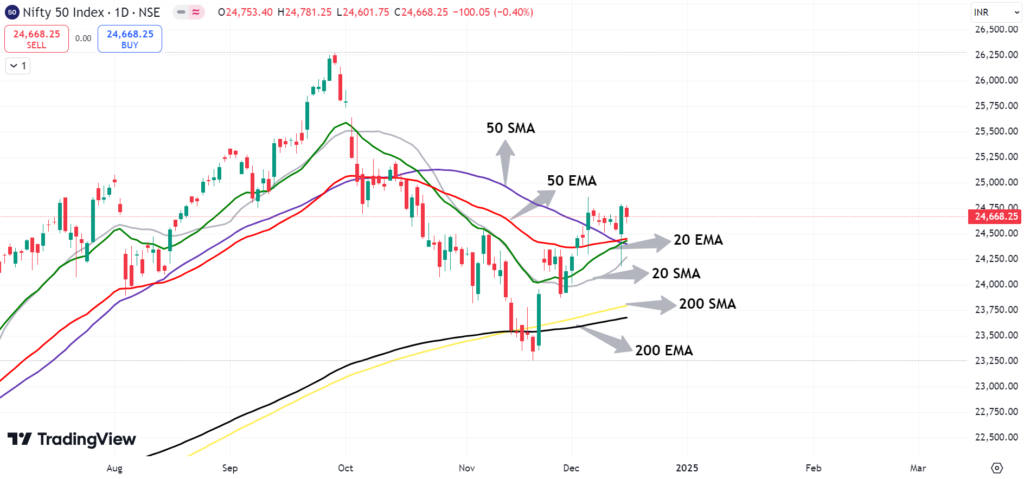
EMA vs SMA
EMA vs SMA becomes a matter of the trader’s style and goals:
- EMA responds more quickly to recent price changes, so it is better for short-term trading.
- SMA is more evenly smoothing data which is better for long-term trends.
The responsiveness of the EMA can be useful if you are a day trader or scalper, allowing you to quickly react to shifts in the market. The SMA may be better at filtering out market noise for swing or positional traders.
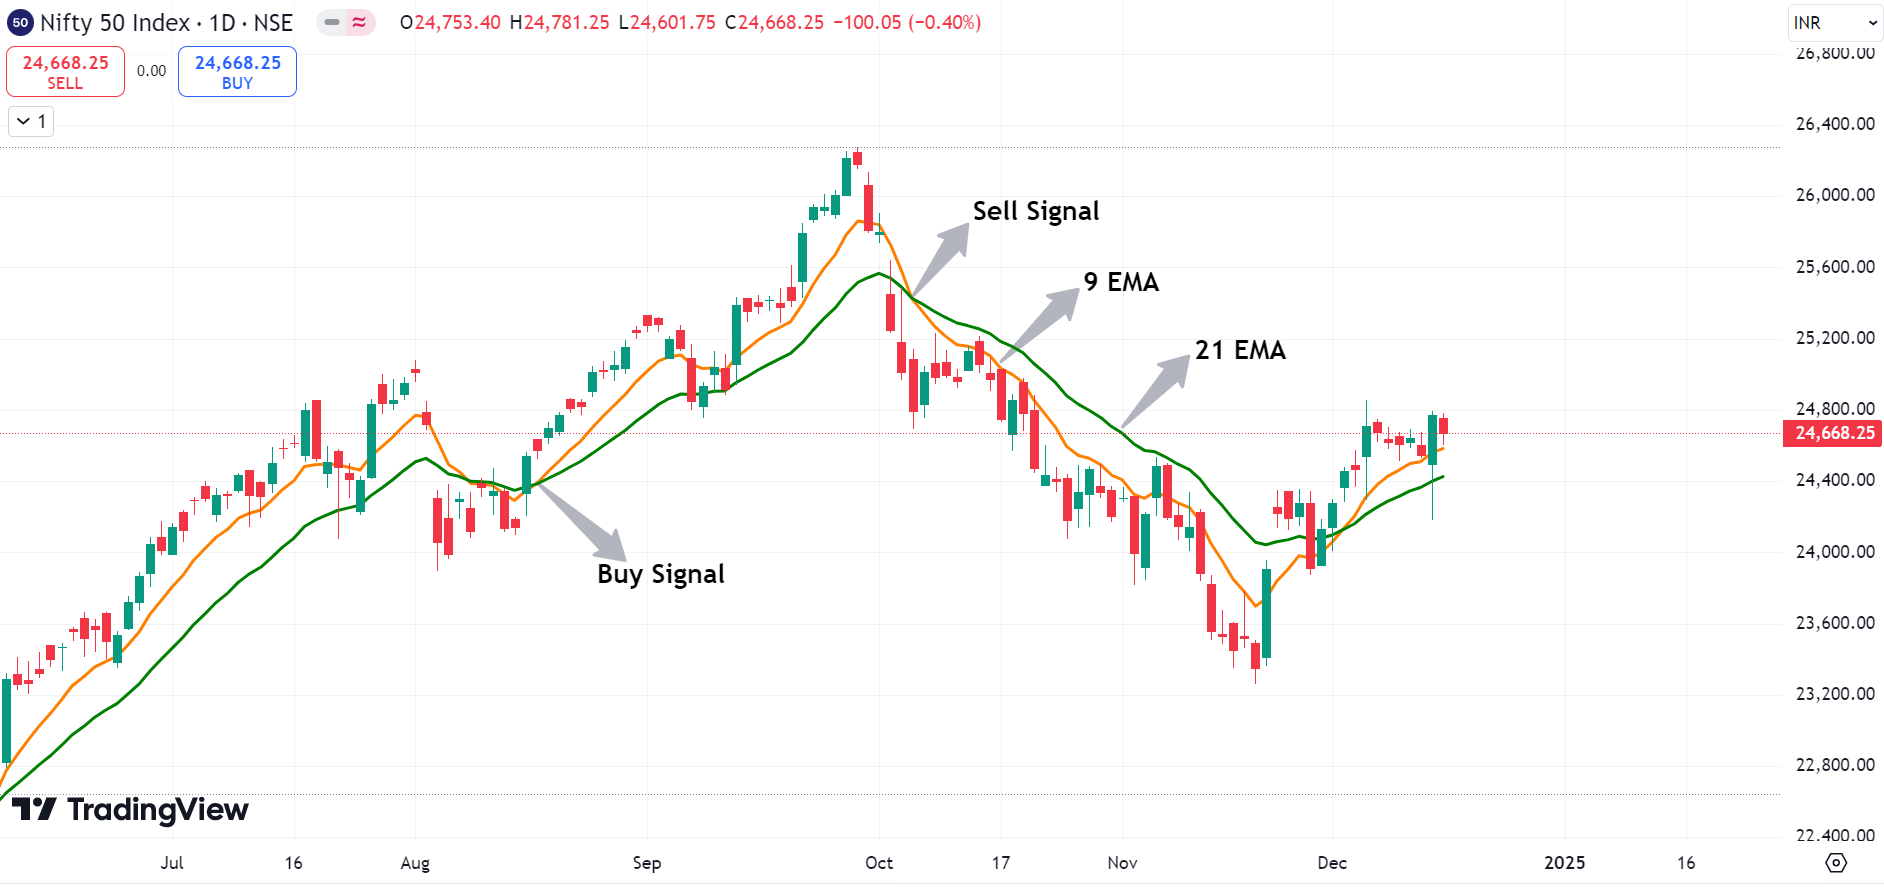
Best EMA Settings for Day Trading
The optimal settings for EMA on day trading depend on the required acceleration and accuracy. Traders apply short-term EMA with 9 EMA and 20 EMA:
- 9 EMA favorable for fast scalp-oriented trades.
- 20 EMA a little wider perspective on intraday chart dynamics.
The following EMA settings are typical for intraday trading, but day traders might use additional indicators for confirmation. As an example, 50 EMA vs 20 EMA grant insight into short-term momentum changes.

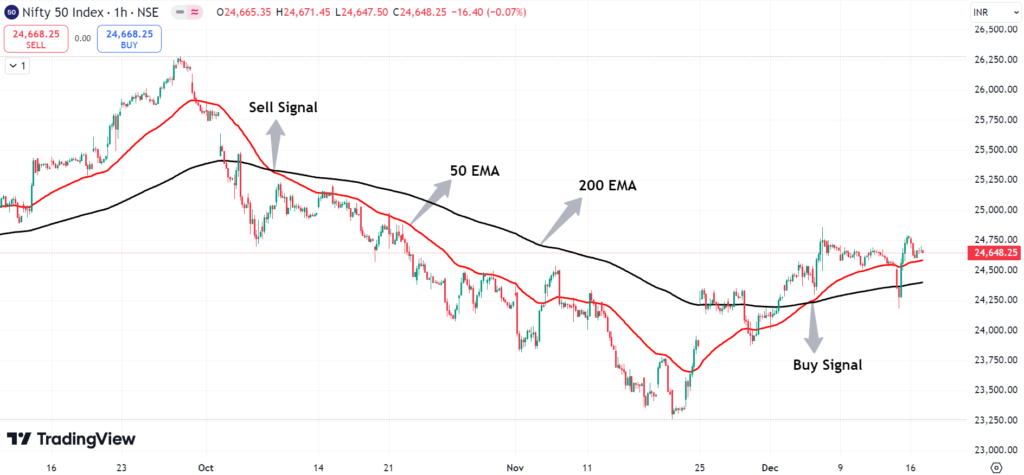
EMA Crossover Strategy
The EMA trading strategy with the most frequent use among traders is the crossover method. It uses two moving averages, each of which has a different duration.
- The pioneering signal is called the Golden Cross. This is when the 50 EMA crosses upward the 200 EMA and gives a bullish signal.
- The second signal is the Death Cross. The bearish signal is given when the 50 EMA is crossed by the 200 EMA to the downside. This strategy is well suited to signal about the reversal of trend movement.
Best EMA for Intraday Trading
Short-term EMAs such as the 9 EMA, and 20 EMA perfectly excel in intraday trading. This is because they respond immediately to changing prices. Furthermore, in volatile markets, EMA for short durations works better.
EMA use in Technical Analysis
The necessity of EMA use in technical analysis is paramount in predicting short-term price movement. This is primarily done by observing the momentum of the market. Here are some of the analyses done using EMA cushions.
- Pullbacks during trends.
- Identification of breakout levels.
- Monitoring of price effect after bouncing off the EMA ranges.

EMA Strategy for Beginners
Save EMA strategy beginners can try and improve upon later: once again follow the only EMA – 50 EMA and use it only for trend purposes. However, try to take trades bounces off the 50 EMA that is in the direction of the trend with further conformation made by RSI.
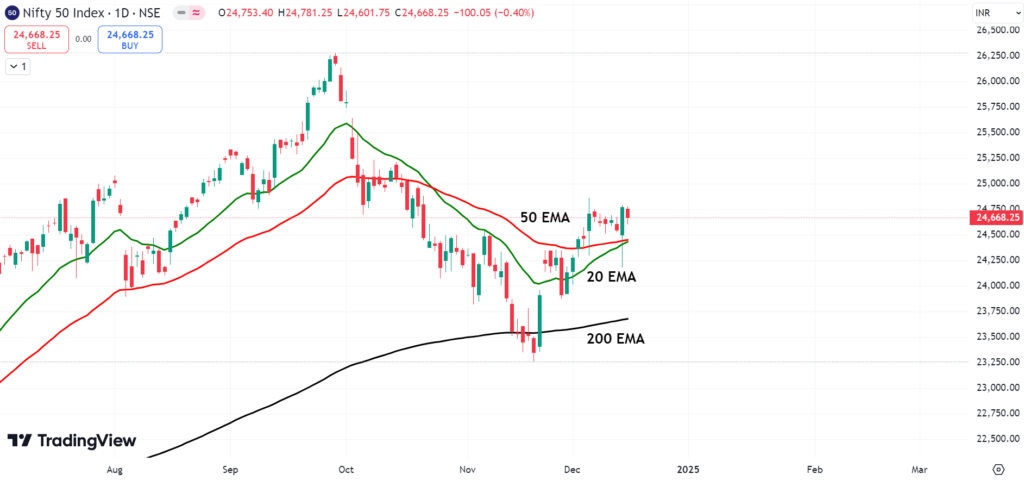
200 EMA Trading Strategy
The long-term trend indicator is 200 EMA – long-term and multiple instruments one. Buy entry would be identified if the price is above 200 EMA, and resistance level is low below. Sell entry would be identified if the price is below 200 EMA line. Perfect with the point of a comparison of the bear and bull market. Suitable for positional or swing trading.
Best EMA Settings for Swing Trading
Swing traders tend to look toward the medium-term EMAs like the 50 EMA and 100 EMA:
- 50 EMA: A good hedge at capturing short-term swings.
- Long-term trends can be filtered with the 100 EMA: · 100 EMA: Trade Filtering in the Direction of the Broader Trend
How to Use EMA in Stock Market Trading
For instance, in the stock market, EMA aids investors in making data-driven decisions. Here’s how:
- Trend Following: The EMA can be used to spot the direction of the market and align trades.
- Dynamic Stop Losses: Use stop-loss orders situated slightly below the EMA line to minimize risk.
- Reversal Indicators: Use EMA crossovers to identify reversal signals
EMA Trading Strategies for Beginners
The EMA trading strategies for beginners can help beginners gain confidence. A simple approach involves:
- Crossovers of two EMAs (e.g., 9 EMA and 20 EMA)/volume.
- Making trades in the direction of the crossover.
- Place stop-losses below the longer EMA
- Traders also combine EMA with RSI. For details about RSI you can visit https://nifty50trends.com/what-is-relative-strength-index/
Why is EMA Important in Technical Analysis?
This is where EMA comes into play as it reacts to the changing market conditions. Traders prefer EMA for its:
- Accuracy: The sensitivity of the EMA makes it a solid indicator of a trend.
- Any options based on this model can be used with the determination of forex, stocks, and cryptocurrencies markets.
- Ease of Use: Easy calculations and graphic clarity.
- For live market data of Indian Indices you can visit https://www.nseindia.com/market-data/live-market-indices
- EMA can be combined with option chain data also, for example strong puts OI at 23700 shows strong support and 200 EMA is at 23700 level. On combining option chain data with 200 EMA 23700 is a crucial support for upcoming sessions https://www.nseindia.com/option-chain
Conclusion
The EMA is a powerful tool that provides key insights into market trends and momentum. Whether you are just starting to understand the fundamentals or a seasoned trader perfecting your techniques, EMA can boost your performance. EMA strategies help traders know about the prevailing trend of the currency pair, reversal, as well as will help in Risk management. Get to know EMA more know how it can be used to attain consistent trading success!
“Share your predictions for today’s market in the comments below!”