Image Source: AI Generated
Traders often struggle with uncertainty about their market positions. The decision to enter or exit becomes more challenging as multiple signals from leading and lagging indicators point in conflicting directions.
Your trading strategy needs both leading and lagging indicators. Leading indicators predict future price movements, while lagging indicators validate existing trends. The difference between these two is vital to make smart trading decisions and build a strong trading system.
Let me break down five significant differences between these indicator types. The knowledge will help you pick the right tools that match your trading style. You will discover the best times to use each type and ways to blend them together. Most importantly, you’ll learn what mistakes to avoid during your market analysis.
Understanding the Fundamental Nature of Market Indicators
Market indicators help you learn how they interpret market movements. Technical analysis creates the foundation for these tools and uses statistical trends to assess trading activity and identify potential opportunities.
Basic principles of technical analysis
Price movements reflect all available market information – this is how technical analysis works. Market analysis studies price behavior based on trader actions and market psychology. The market factors in everything from company fundamentals to broad market factors, which makes price action your main focus.
How indicators process market data
Market indicators serve as quantitative tools that process market data of all types to forecast potential price movements. They analyze several key elements:
- Price action and trends
- Trading volume patterns
- Market momentum
- Volatility levels
- Market cycles and breadth
These indicators transform raw market data into applicable information through mathematical formulas. The tools help identify high-probability trade entry and exit points by analyzing historical performance patterns.
The role of time in indicator calculations
Time is a vital part of how indicators process market information. Time series analysis looks at data from specific intervals to learn about future movements. Your forecasting accuracy improves with more complete data, as time series analysis helps identify:
Longer time series data leads to more accurate forecasting potential. It’s worth mentioning that market cycles change over time and might disappear temporarily. Markets keep evolving, so you need to adjust your analysis approach based on current conditions. For option chain data visit https://www.nseindia.com/option-chain
Note that technical analysis deals with probabilities rather than certainties. Understanding how indicators process time-based data helps you make informed trading decisions. You’ll choose and apply the right indicators for your trading strategy once you understand these simple aspects.
Core Characteristics of Leading Indicators
Leading indicators act as your early warning system in the markets. They forecast price movements before they happen. These indicators process current market data to predict future trends and give you an edge in your trading decisions.
Predictive nature and methodology
Leading indicators look at current market conditions to spot future price movements. They track buying pressure, momentum changes, and market sentiment to generate early signals. Your trading becomes proactive instead of reactive because these tools help you spot market changes before they fully develop.
Popular leading indicator examples
Here are some common leading indicators that shape trading strategies:
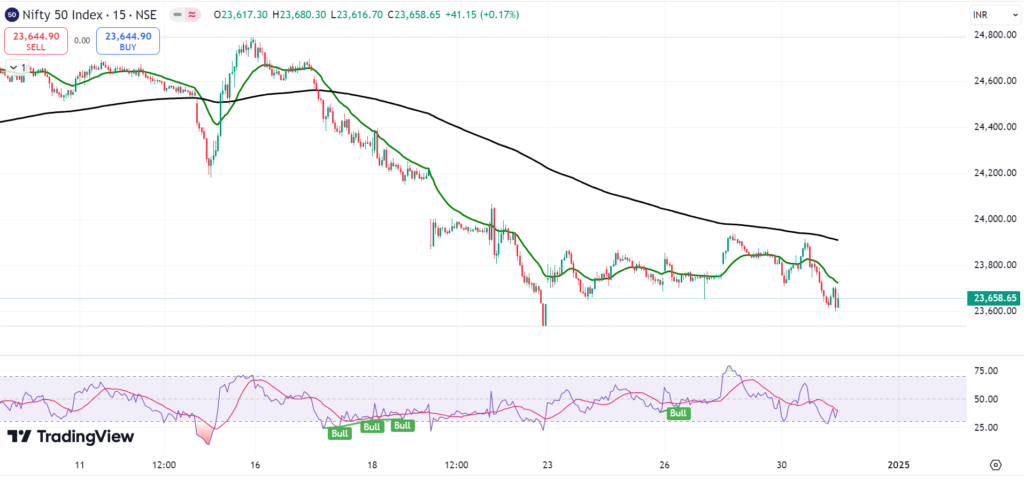
- Relative Strength Index (RSI): Measures momentum and spots overbought or oversold conditions between 0 and 100. Readings below 30 point to oversold conditions while readings above 70 show overbought situations. For more information about RSI visit https://nifty50trends.com/what-is-relative-strength-index/
- Stochastic Oscillator: Compares current closing prices to previous trading ranges and helps you find potential reversal points
- Moving Average Convergence Divergence (MACD): Takes a closer look at rapid price changes using settings of 12, 26, and 9 periods. For more information about MACD visit https://nifty50trends.com/moving-average-convergence-divergence-macd/#more-426
Strengths and limitations in trading
You need to know both the good and bad sides to use leading indicators well:
Key Strengths:
- Gives early warning signals about price changes
- Lets you make proactive trading decisions
- Spots possible market reversals early
Notable Limitations:
- Might show false signals in volatile markets
- Different traders interpret signals differently
- Results vary based on market conditions
Leading indicators work best as part of a complete strategy. They are a great way to get predictive insights, but don’t make decisions based on their signals alone. Try combining them with other analytical tools to confirm potential trades and manage your risks.

Essential Features of Lagging Indicators
Lagging indicators act as confirmation tools during market trend analysis and help verify price movements that have already started. These indicators process historical data to show clear pictures of market patterns that are already in place. They work like a GPS after navigating through foggy condition.
Confirmation-based approach
Lagging indicators filter out market noise and confirm long-term trends. These indicators appear directly on price charts, making them accessible tools that verify trends. Past price data helps traders understand if a trend exists before they execute trades.
Common lagging indicator types
The technical analysis toolkit has several reliable lagging indicators:
- Moving Averages (MAs): These smooth out price action and provide a clear visual of market trends that use historical prices to calculate average values
- Bollinger Bands: Built on a 20-period simple moving average with two standard deviation bands that measure volatility
- Moving Average Convergence Divergence (MACD): Uses two moving averages to determine trend direction and strength
- Average Directional Index (ADX): Measures trend strength, with readings above 25 showing strong trend formation

Reliability and drawbacks
Lagging indicators offer greater accuracy in trend confirmation, yet they come with specific trade-offs to think over. Their reliability comes from slower reactions to price changes, which results in fewer false signals compared to leading indicators. The accuracy comes at a cost – much of the price movement may have already occurred by the time you receive a signal.
Delayed signals might cause traders to miss early trend stages where most movement occurs. This makes them valuable for long-term trend trading but less effective for catching early market reversals. Traders can maximize effectiveness by combining them with other analytical tools. To cite an instance, many traders pair Bollinger Bands with leading indicators like RSI for a complete analysis.
Note that lagging indicators excel at confirming trends and work best as part of a broader trading strategy rather than standalone decision tools. Their strength lies in verifying market movements and maintaining positions in established trends instead of predicting future price action.
Critical Differences in Trading Application
Your trading success largely depends on knowing at the time and how to use leading and lagging indicators. The secret lies in picking the right tool for specific market conditions and managing the risks that come with them.
Market condition suitability
Market environments need different analytical approaches. Your choice between leading and lagging indicators should line up with current market conditions:
- Trending markets: Lagging indicators shine in strong trends and give reliable confirmation signals
- Range-bound markets: Leading indicators work better when prices move sideways and help spot potential breakouts
- Volatile markets: Both indicator types can give false signals that need extra confirmation
Risk management considerations
Good risk management means you understand the uncertainty in both indicator types. Leading indicators quickly respond to price changes. They work well for short-term trading but often give false signals. Lagging indicators give more accurate results but might delay your market entry. This delay could affect your risk-reward ratio.
Your risk management strategy should push you to ask: “What steps can I take to be more successful?”. This forward-looking viewpoint helps you prepare for market moves instead of just reacting to them.
Implementation challenges
Using these indicators brings several key challenges. Leading indicators might stay overbought or oversold for long periods during strong trends. This can lead to wrong momentum interpretations. Lagging indicators often give explanations too late for action, especially in ever-changing markets.
A balanced approach helps overcome these challenges. Leading indicators predict future performance and guide daily decisions. Lagging indicators confirm your strategy’s success over time. This mix helps you keep a clear viewpoint while dealing with market complexities.
The truth is no single indicator works perfectly. Success comes from knowing each tool’s limits and using them with other analytical methods. Understanding these challenges helps you set realistic expectations and create well-laid-out trading strategies.
Both indicator types can act differently during major economic changes or policy shifts. Keep your approach flexible and check your indicator choices based on current market conditions and trading goals.
Combining Leading and Lagging Indicators
A successful trading strategy combines leading and lagging indicators to work together effectively. These powerful tools create a complete picture of market movements that leads to better trading decisions.
Complementary indicator strategies
Leading and lagging indicators serve as market navigation tools. They create a dynamic feedback loop that improves your decision-making process. Here’s how they work together:
- Leading indicators spot potential opportunities early
- Lagging indicators verify essential trends
- Combined analysis boosts your trading confidence
- Cross-verification makes signals more reliable
- Live adjustments become precise
The right mix of indicators across timeframes makes all the difference. Leading indicators identify potential entry points, while lagging indicators verify the broader trend direction to create a reliable trading approach.

Avoiding conflicting signals
Multiple indicators might give contradicting signals that cloud your judgment. These steps minimize confusion:
- Avoid indicators of the same type
- Focus on different price action aspects
- Set a clear hierarchy for signals
- Define specific roles for each indicator
- Stay systematic in signal interpretation
Too many indicators showing similar information lead to analysis paralysis. Select tools that give unique insights into market conditions instead.
Creating a balanced approach
Your ability to combine indicators depends on understanding market conditions and using the right tools at the right time. Stochastic oscillators prove more useful in sideways markets, while moving averages work better in trending markets.
The best strategy uses leading indicators to spot opportunities and lagging ones to verify your analysis. This method helps you:
Optimize Entry Points: Leading indicators identify possible market reversals early, and lagging indicators verify the broader trend direction.
Manage Risk: Confirmation from lagging indicators reduces false signals from leading indicators.
Adapt to Market Changes: Market conditions need different approaches. Your strategy should adjust when market dynamics transform.
Regular reviews of correlation between leading and lagging indicators keep your strategy effective. A mismatch between predicted and actual outcomes suggests adjusting your indicator selection or weightings. This refinement process keeps your trading strategy reliable in markets of all types.
Good judgment plays a vital role in combining indicators effectively. Systematic approaches have their place, but successful trading needs signal interpretation within the broader market context rather than rigid rules.
Conclusion
Market indicators are key tools for trading success. Leading and lagging indicators each play crucial roles in your decision-making process. Leading indicators help you spot opportunities early, while lagging indicators verify your trading decisions.
Your trading performance depends on how well these indicators work together, not as competing tools. The market environment determines which indicator type works best. Leading indicators work well in range-bound markets, and lagging indicators perform better during strong trends.
No single indicator gives perfect signals. A solid trading strategy combines both types strategically. Leading indicators provide early signals, and lagging indicators confirm trends. This balanced approach reduces false signals and creates more opportunities in different market conditions.
Smart selection and use of both indicator types, plus regular strategy updates, will deepen your market understanding. This knowledge leads to smarter trading decisions and helps you trade consistently.
