Fibonacci Retracement and Fibonacci Extension, Fibonacci Retracement Levels, How to Draw Fibonacci Retracement & Extension
Fibonacci retracement and Fibonacci extension is one of the more powerful tools in technical analysis. Traders commonly use these tools to find possible levels of support and resistance in the market. In this article we will guide you through in-depth Fibonacci retracement levels explained, how to use Fibonacci retracement levels, and Fibonacci extension strategies.
What is Fibonacci Retracement?
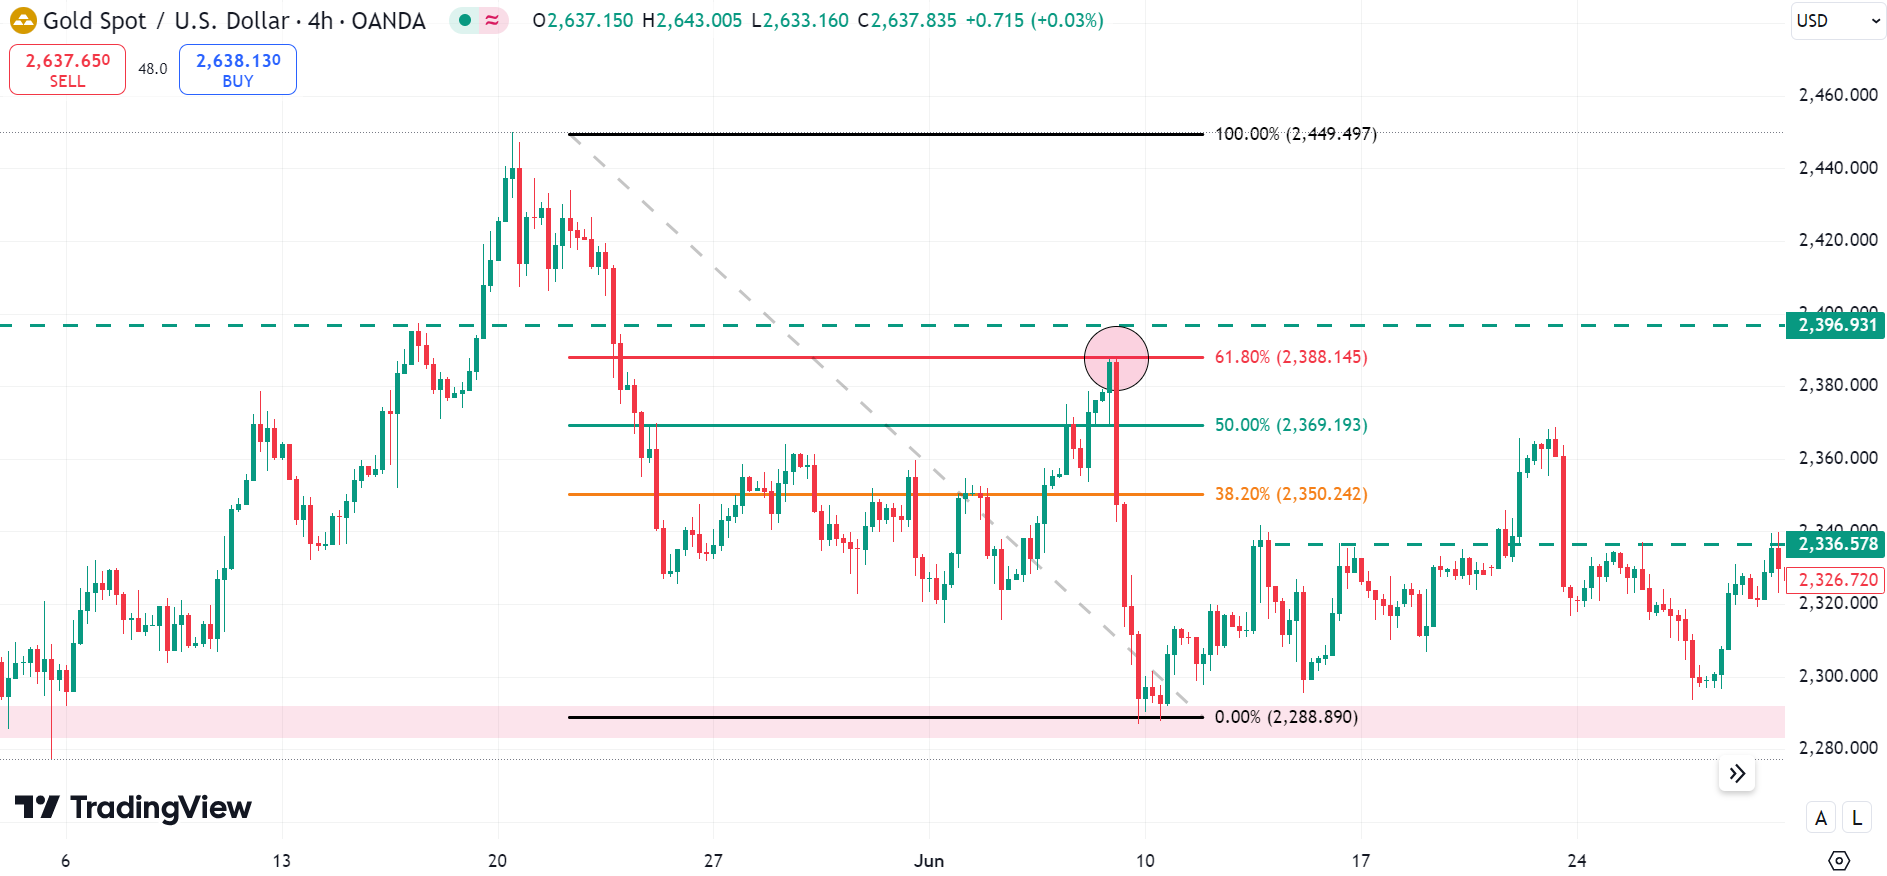
What is Fibonacci Retracement? These are derived from the Fibonacci sequence, in which each number is the sum of the two preceding ones. 23.6%, 38.2%, 50%, 61.8%, 78.6% are the most popular retracement lines.
These are the percentage distance a price may retrace from its all time high or bottom. Traders identify a swing high and a swing low and then draw the retracement tool between them to start looking for Fibonacci retracements.
Fibonacci Retracement Levels Explained
- 23.6% Level: This level is a shallow retracement level and is typically seen in strong trends.
- 38.2%: A Level of moderate significance, provides strong support or resistance
- 50% Level: Not a “true” Fibonacci level, but a level that many use due to its psychological significance.
- 61.8% Level: This is the most important of all reversal levels, also known as the Golden Ratio.
- 78.6% Level: This level represents a deeper retracement, and it is often seen as a potential reversal zone.
How to Draw Fibonacci Retracement
Steps to draw Fibonacci retracement levels
- High swing high > swing low > Price movement.
- Most trading tools feature a Fibonacci retracement tool for this purpose.
- Join the swing high and low, and the erosive will be retracement levels.
- Watch the price response at these levels.
Trading with Fibonacci Retracement and Extension
Fibonacci retracement levels should not be used in isolation, it works in conjunction with other technical analysis tools such as trend lines, moving averages or candlestick patterns. These levels are often used by traders to:
- Identify entry points on drawn downs.
- Determine possible stop-loss and take-profit levels.
- Verify the strength of a trend.
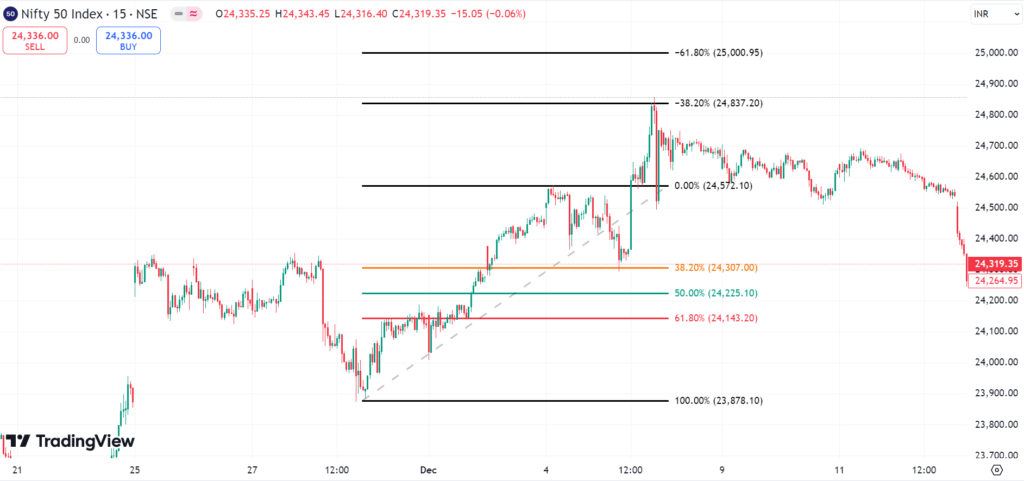
Fibonacci Extension Explained
Whereas retracement levels are concerned with pullbacks, Fibonacci extension levels do the opposite by allowing traders to project potential future price targets. The relevant extension levels, therefore, are 61.8%, 100%, 161.8%, 200%, and 261.8%. These levels are computed outside of the current price movement, so they are great candidates for Fibonacci extension levels in stock trading.
How to Use Fibonacci Extension in Trading
- Find an area where price has moved (swing high to swing low or other direction.
- The Fibonacci extension tool is drawn using three points; the swing high, swing low, and retracement point.
- Watch the extension levels to determine possible targets.
Fibonacci Extension Strategies
It is also extremely useful for profit-taking strategies in the Fibonacci Extension. For instance:
- Trend Following: The first target for traders is the 161.8% & extended targets are 261.8% in a strong uptrend.
- Breakout Trading: The immediate target after a breakout is often 100%.
Fibonacci Retracement vs. Extension
Although both tools utilize Fibonacci levels, they serve different purposes:
- Retracement: concentrates on finding pullback levels within a trend.
- Extension: Project price levels outside the current trend in order to find targets.
Best Fibonacci Retracement Tool
This is the correct Fibonacci retracement tool for your Trading platform. Many trading platforms including Meta Trader, Trading View, Zerodha, etc. have very easy tools to draw the Fibonacci tool members. The tool you use should be flexible enough for you to easily customize what levels and colors you want to see.
Fibonacci Levels in Technical Analysis
This guides the next steps of charting and prediction as Fibonacci levels are heavily distributed into technical analysis for it can be used in any type of market, be it stocks, commodities, forex, or even cryptocurrencies, and over any timeframe. All of this correlates with natural market movements and gives you a format to freaky your price movement with. You can also use various indicators like EMA with Fibonacci https://nifty50trends.com/exponential-moving-average-ema/
Fibonacci Trading Strategies for Day Traders
Fibonacci trading strategies are used by day traders to spot opportunities in shorter time frames. There are several effective approaches:
- Trend Trading: Fibonacci retracement levels can be applied on any trend and to enter a trade on pullbacks.
- Breakout Trading: Look for price action at nearby Fibonacci levels to confirm breakouts
- Confluence Zones: You can add support and resistance, trend lines or moving averages to Fibonacci levels for stronger signals.
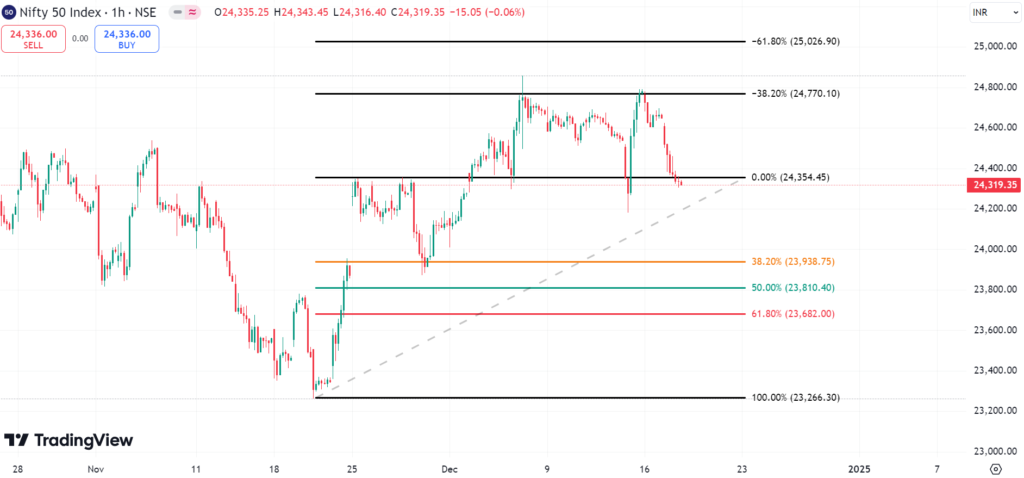
Applying Fibonacci Retracement in the Stock Market
The Indian stock market is one of those few places where Fibonacci retracement works like magic, and traders use it to draw Fibonacci retracement on any stocks, be it Reliance or TCS or indices like Nifty50. For Nifty50, one such common level is the 61.8% retracement level which tends to behave like a crucial support/resistance zone.
Advanced Fibonacci Retracement Techniques
- Add Fibonacci levels at different timeframes together to discover strong confluence areas
- Fibonacci Retracement With Harmonic Patterns: Use Fibonacci ratios to trade harmonic patterns like Butterfly, and Bat patterns.
- Fibonacci levels find use in Elliott Wave theory: Fibonacci levels are used to measure potential retracements and extensions of waves within Elliott Wave structures.
Fibonacci Levels for Trend Analysis
Fibonacci levels are essential for analyzing trends. For example:
- Uptrend: Retracements to 38.2% or 61.8% as buying opportunities
- Downtrend: Use to sell or go short on retracements to these levels.
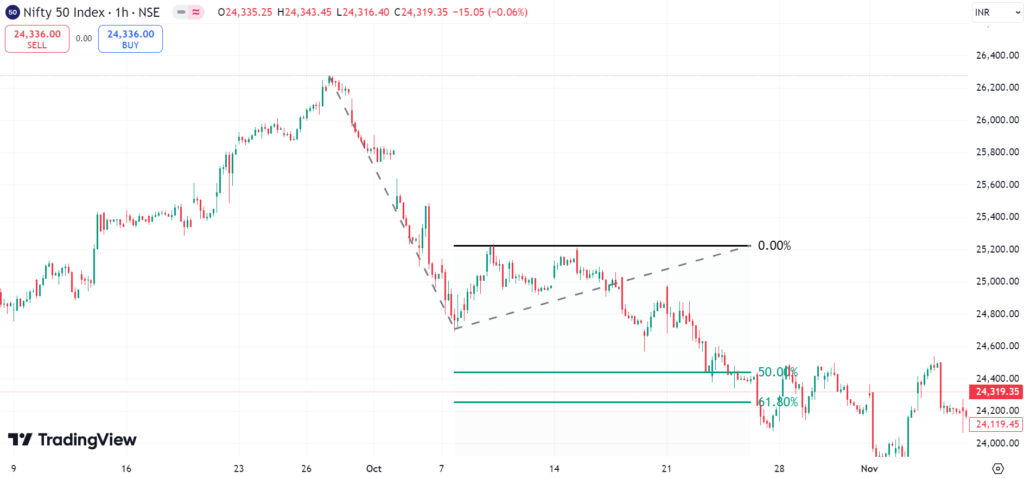
Practical Example: How to Use Fibonacci Retracement and Extension
Now, let’s take an example from the real world: Indian stock market.
- The point here is, This is how you would want to draw Fibonacci retracement levels. Support could come from the 61.8% level at 18,382.
- If Nifty50 moves lower from here, you can draw Fibonacci extension levels and add multiple targets like 19,618 (161.8%).
Conclusion
Fibonacci retracement and extension are the bread and butter of any trader. They help you to analyze such things as price movements, identify different levels of support/resistance, and set achievable price targets. Knowing how this works, traders can use Fibonacci retracement and extension to improve their strategies and success rate.
Practice Fibonacci retracement and extension for beginners on historical charts before moving on to live accounts. While beginners will appreciate the basic functionalities of this application, advanced traders can benefit from integrating these tools with their advanced Fibonacci retracement techniques and more sophisticated analyses leading to even more precise trading decisions.
Keep in mind, no tool is a surefire recipe for success, but, with repeated use and discipline, Fibonacci tools can be an indispensable tool in your trading toolkit.
“Share your predictions for today’s market in the comments below!”