Moving Average Convergence Divergence (MACD), How to use MACD in Trading, MACD Strategy for Beginners, Advanced MACD Strategies, Types of MACD Trading Signals, Advantages of Using MACD, Limitations of MACD.
Moving Average Convergence Divergence (MACD) is one of the building blocks of technical analysis used by traders globally to detect trends, gauge momentum, and look for potential trades. It has been proven that whether you are a professional trader or a newcomer, knowing the MACD Indicator will increase significantly your strategy.
In this blog, we’ll cover the basics of the MACD, how to use the MACD in your trading, along with some MACD strategies that you can implement immediately to make better decisions. Furthermore, we will also review the various MACD trading signals that can help you identify entry and exit points in the market.
What is Moving Average Convergence Divergence (MACD)?
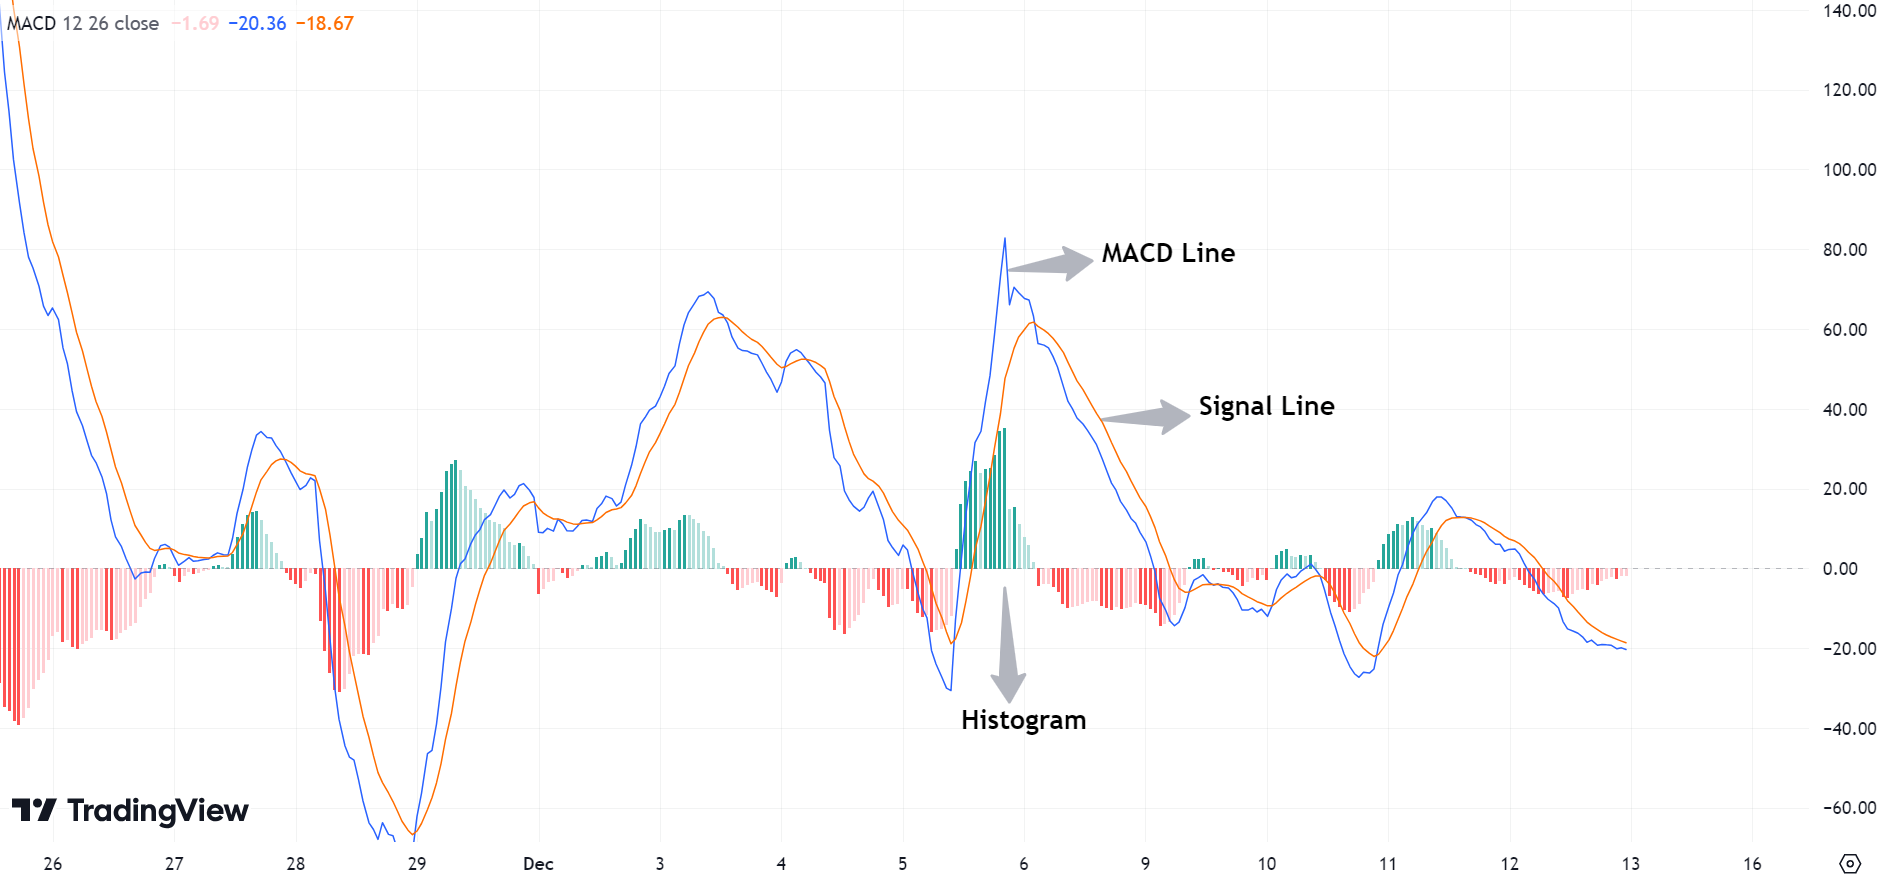
The MACD Indicator is a momentum tool that correlates moving averages to understand the force and direction of a trend. It is made up of three main parts:
- MACD Line: The difference between 12-period EMA and 26-period EMA.
- Signal Line: The EMA of the MACD line (usually 9 periods) that is used to create buy and sell signals.
- The histogram: It is the the difference between the MACD line and the signal line. It shows the trend’s momentum.

How to Use MACD in Trading
Learn how to use the MACD Indicator correctly to succeed! There are three main ways to use MACD in your trading:
Identify Trend Direction:
- A bullish momentum scenario is when the MACD line crosses above both the signal line and the zero line.
- On the other hand, if MACD line is below the signal line and the zero line, then indicates bearish momentum.
Spotting Crossovers:
- Bullish Crossover: The MACD line crosses above the signal line, signaling a potential upward trend.
- Bearish Crossover: The MACD line crosses below the signal line, signaling a potential downward trend.
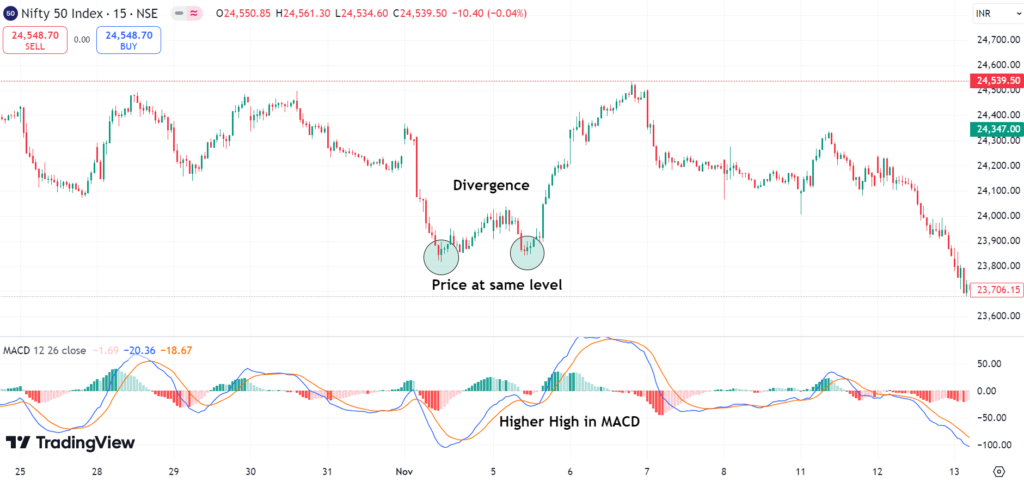
Divergence in MACD:
- Bullish Divergence: Price puts in lower lows and the MACD makes higher lows showing a potential reversal to the up.
- Bearish Divergence: Price makes higher highs but the MACD makes lower highs which could indicate a potential reversal to the downside.
Zero Line Crosses:
- The bullish momentum of the MACD is confirmed when the MACD line moves above the zero line.
- The bearish momentum of the MACD is confirmed when the MACD line moves below the zero line.
MACD Strategy for Beginners
For new traders, this simple MACD strategy gives clarity and confidence. Here’s a simple way to do this:
- Setup: Use Default MACD setting 12, 26, 9.
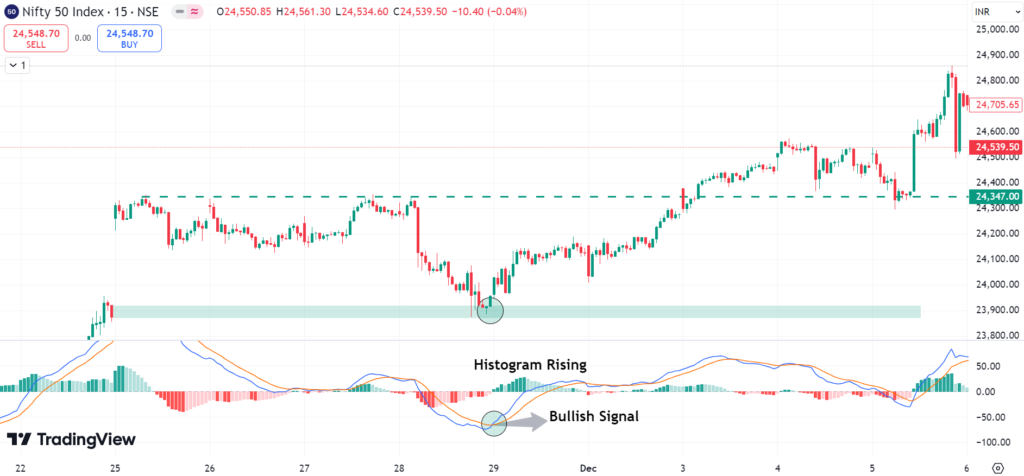
- Bullish signal: Open a long position if the MACD line crosses above the signal line and the histogram increases its positive value.
- Bearish Signal: Exit a trade or initiate a short position when the MACD line dips below the signal line and the histogram reveals growing negative values.
- Stop-Loss and Take-Profit: Use nearby support and resistance levels to determine where to place your stop-loss and take-profit levels.
Advanced MACD Strategies
Once you’ve learned the basics, you can add more advanced MACD strategies to improve your trading style:
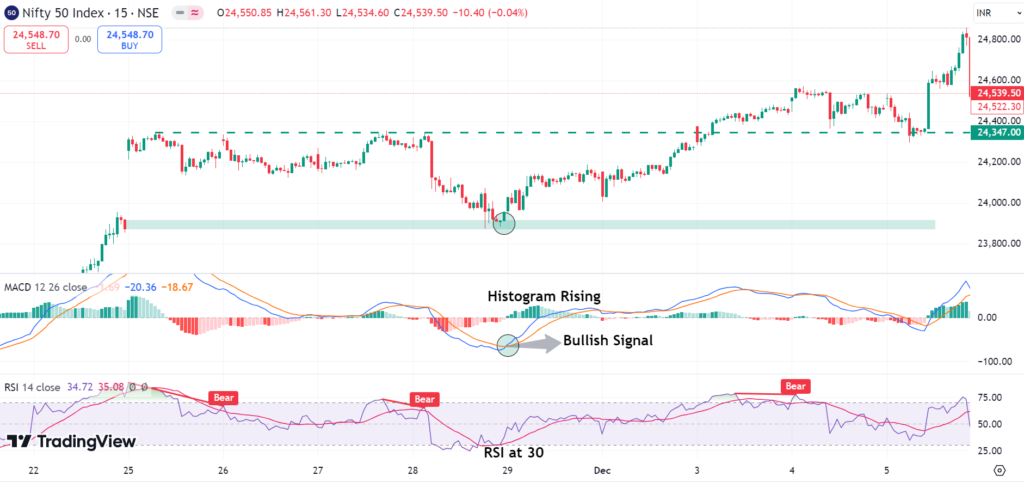
Combining MACD with RSI:
The MACD also identification overbought and oversold market conditions, TPU is often used in conjunction with the Relative Strength Index (RSI) for confirmation. You also can have a bullish crossover of MACD with RSI under 30, which usually means to buy.
MACD Histogram Analysis:
Notice how the histogram expands and contracts. A growing histogram indicates increasing momentum and a shrinking histogram indicates weakening momentum.
Multiple Timeframe Analysis:
Confirm trends by analyzing MACD on multiple timeframes. For instance, look for MACD on the daily chart lining up with MACD on an hour chart for confluence.
Zero Line Reentry:
Look for the MACD line to cross above the zero line again following a bearish (downward) cycle. This may herald the beginning of a new bullish cycle.
Types of MACD Trading Signals
The MACD Indicator can produce 3 generic signals:
Crossover Signals:
- Buy Signal: MACD line crosses above signal line.
- Sell Signal: When the MACD line crosses below the signal line.
Histogram Signals:
- Larger histogram bars reflect growing momentum.
- The histogram bars are decreasing suggesting weakening momentum.
Divergence Signals:
- Divergence between price and MACD can anticipate major trend reversals. For example, if the price is making higher highs but MACD is not, it indicates an upcoming downtrend.
Advantages of Using MACD
- User-Friendly: Since the MACD is visual, it’s easy to use, even for beginner traders.
- Flexibility: Ideal for multiple asset classes (stocks, forex, commodities, etc.
- Momentum and Trend Analysis: Integrates both momentum and trend-following elements into a single indicator.
- Configurable Parameters: Traders can customize the MACD settings for various trading styles and timeframes.
Limitations of MACD
Although the MACD Indicator has a lot of benefits, it has some limitations:
- Lagging Indicator: Since MACD is a trend-following indicator, it may lag price action and can provide delayed signals.
- False Signals in Ranges: MACD signals in sideways markets may lead to errors.
- Bias: Interpretation of divergences can differ from trader to trader.
Customizing MACD Settings
While the default settings (12, 26, 9) are suitable for most markets, traders have the flexibility to test custom settings:
- Use (6, 13, 5) settings for short-term trades.
- Long-Term Trading: Choose settings, such as those with (19, 39, 9), for more gradual signals across longer periods.
MACD In Action – A Real World Example
For example, consider trading a stock such as Infosys. For example, the MACD crosses above the signal line, and the histogram begins to expand. That shows bullish momentum and generates a buy signal. As the MACD line crosses below the signal line and the histogram rolls over, you exit the trade for a profit. Alone trades in correlation when monitoring the MACD Indicator
Signals that can be useful when trading with the MACD
- Use in Conjunction with Other Indicators: Confirm MACD signals with other methods, such as Bollinger Bands or Moving Averages.
- Test Strategies: Run your MACD strategy against past data first before deploying it in the live markets.
- Track Divergences: Look for divergences to identify potential reversals.
- Adapt to the Market Environment: Be aware of whether the market is in a trend or range and act accordingly.
Summary
The Moving Average Convergence Divergence (MACD) is highly effective for pointing out trends, momentum and potential reversals in the market. Understanding how to apply the MACD Indicator and the use of the MACD strategies in trading can equip you to make informed trading decisions that can help improve your overall trading performance.
As a note, no singular indicator is a be all end all, but using the MACD in conjunction with other strategies and being disciplined in your approach can give you a sharper edge when trading.
“Share your predictions for today’s market in the comments below!”