

Predicting Nifty 50 using technical indicators, Technical indicators are mathematical calculations based on price, volume and open interest data from the past. The do assist trading practitioners to find price movement and trends and thus become their entry and exit points. On the technical indicators front for Nifty 50, this may suggest a bullish sentiment and a technical bullish. This blog will guide you how you can use technical indicators to analyze and predict the trend of Nifty 50
Key Types of Technical Indicators
Based on their functions, technical indicators come in several categories:
- Trend Indicators: Determines trend direction and strength.
- Momentum Indicators: Track the speed price moves.
- Volume Indicators: examines the strength of the trend ву analyzing the trading volumes.
- Volatility Indicators: Show the extent of price movement.
These categories, when combined, is typically the best method for Nifty 50 predictions.
Essential Technical Indicators for Nifty 50
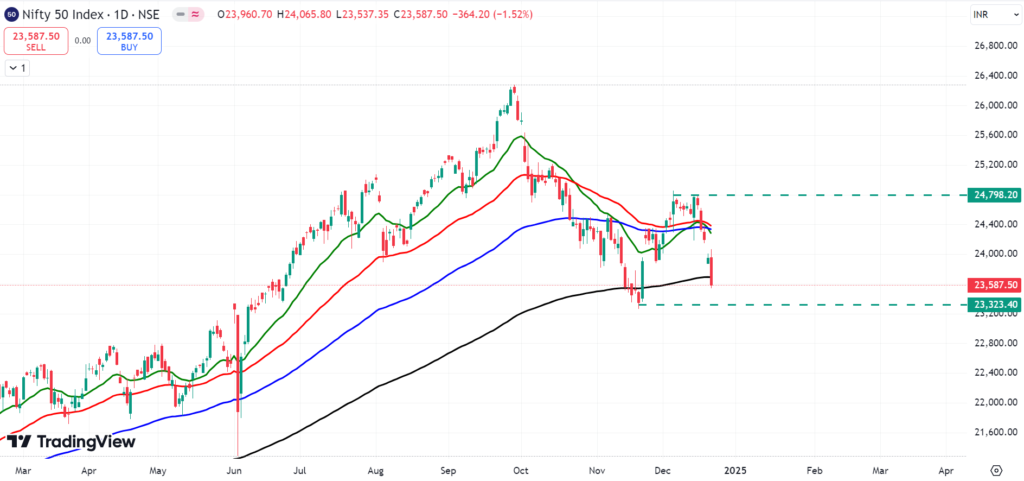
Exponential Moving Average (EMA)
Exponential Moving Average is an important indicator in technical analysis because it responds more rapidly to current price changes. Its applications include:
- Trends Identification: EMA is been used by the traders to identify the trend of the market. An upward EMA is an uptrend and a downward EMA is a downtrend.
- Dynamic Support & Resistance: EMAs act as dynamic support or resistance levels that are used when the market is trending
- EMA Trading Techniques: These patterns can be used for Intraday, Swing and Positional trading setups.
- Identifying trends in price action
- Provide live support and resistance levels.
- Finding a good entry and exit points.
The optimal settings for EMA on day trading depend on the required acceleration and accuracy. Traders apply short-term EMA with 9 EMA and 20 EMA:
- 9 EMA favorable for fast scalp-oriented trades.
- 20 EMA a little wider perspective on intraday chart dynamics.
The following EMA settings are typical for intraday trading, but day traders might use additional indicators for confirmation. As an example, 50 EMA vs 20 EMA grant insight into short-term momentum changes. For more information about EMA you can visit https://nifty50trends.com/exponential-moving-average-ema/

Relative Strength Index (RSI)
Relative Strength Index is a technical indicator used to check overbought and oversold areas in a stock, indices and crypto currencies.
- Overbought: This is the term assigned to an asset that is seen to be overpriced and trading more than its fair value; generally on the RSI scale above 70
- Oversold: A term given to an asset which is considered as undervalued and trading below its reasonable value, usually less than 30 on the RSI scale.
These are called levels where traders can know when to enter and exit the trade according to overbought and oversold levels in RSI. For more information about RSI you can visit https://nifty50trends.com/what-is-relative-strength-index/
Interpreting RSI Values
The RSI value can provide critical information about the market behavior.
RSI Above 70:
- Signifies the asset might be overbought.
- Buyers losing power, so there might be a reversal or pull back.
RSI Below 30:
- Possible indication that the asset is oversold.
- Indication of potential turning point in price as sellers become exhausted.
RSI Between 30 and 70:
- Characterized as a market that is neither overbought nor oversold.
- Low directional bias, mainly sideways market when RSI is around 50 level.


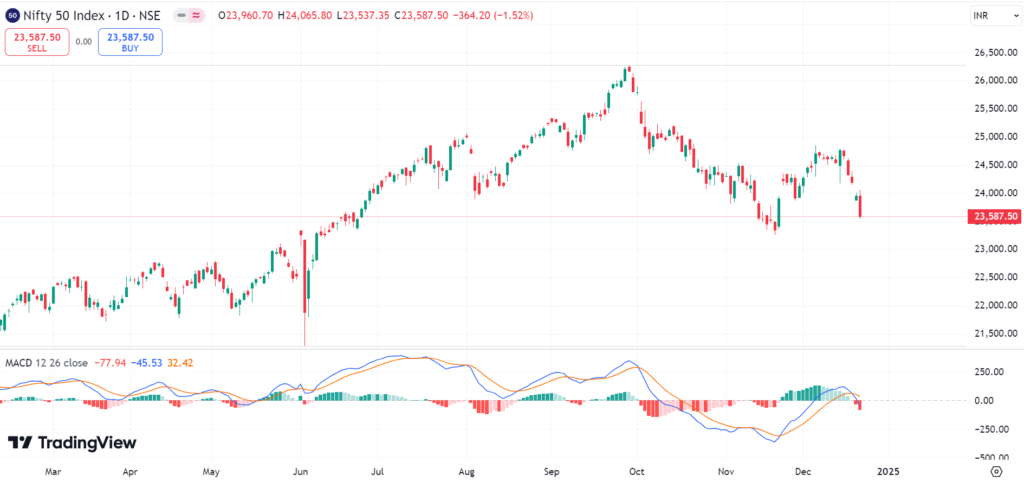
Moving Average Convergence Divergence (MACD)
Often, MACD Indicator is a momentum tool, which can correlate moving averages to know about the strength in a specific trend and the direction of it. It consists of three principal components:
- MACD Line: 12-period EMA – 26-period EMA.
- Signal Line: the EMA of the MACD line (usually 9 periods) that is used to generate buy and sell signals
- The histogram: It is the the difference between the MACD line and the signal line. It has new momentum, showing the trend’s strength.
The MACD Indicator can generate 3 generic signals:
Crossover Signals:
- Buy Signal: MACD line crosses above signal line.
- Sell Signal: When the MACD line crosses below the signal line.
Histogram Signals:
- Larger histogram bars reflect growing momentum.
- The histogram bars are decreasing suggesting weakening momentum.
Divergence Signals:
- Divergence between price and MACD can anticipate major trend reversals. For example, if the price is making higher highs but MACD is not, it indicates an upcoming downtrend.
For more information about MACD you can visit https://nifty50trends.com/moving-average-convergence-divergence-macd/

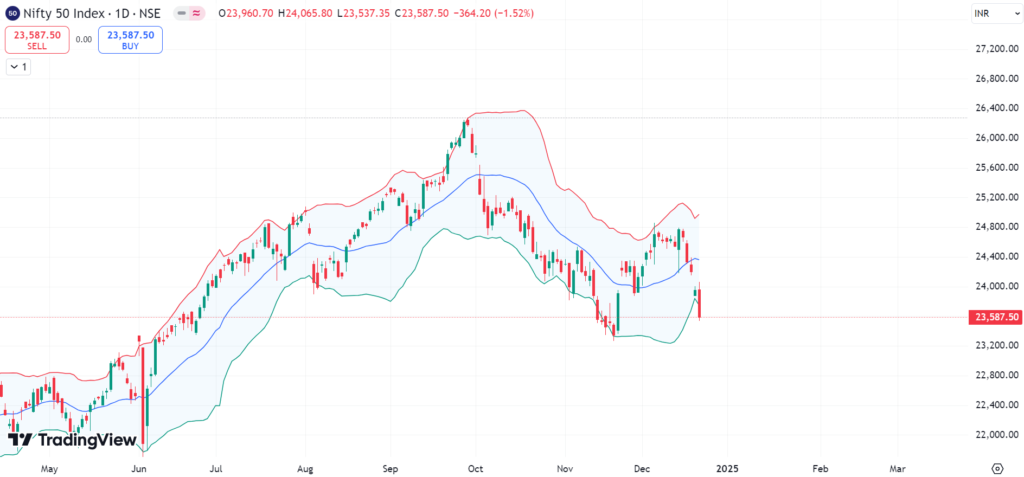
Bollinger Bands
They will use a middle band (SMA) plus two bands above and below it that represent either a standard deviation. These bands adjust up and down in accordance with market volatility.
Application:
- Similarly, if the price reaches the top band, it could be a signal that the market is overbought.
- However, when the price reaches the lower band, it could signify oversized conditions.
- Squeezes (narrow bands) usually happen before big price movements.

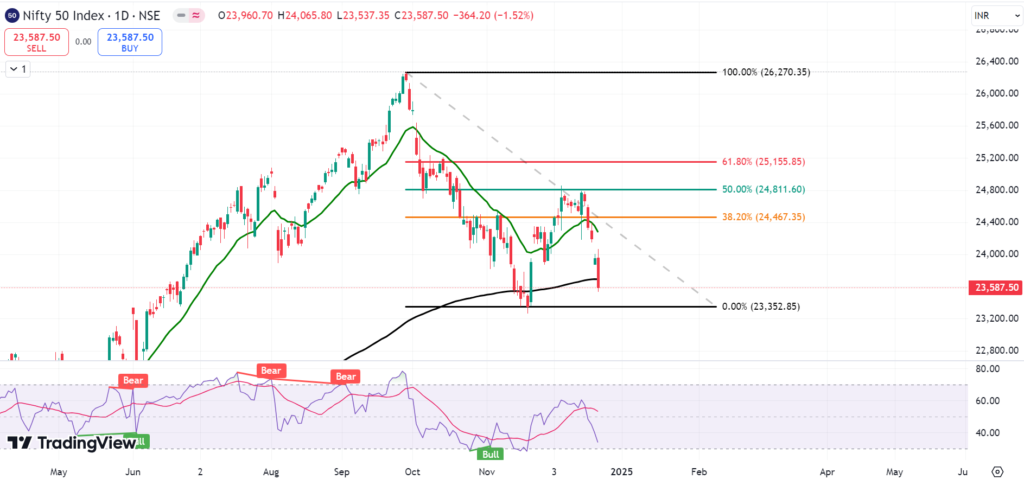
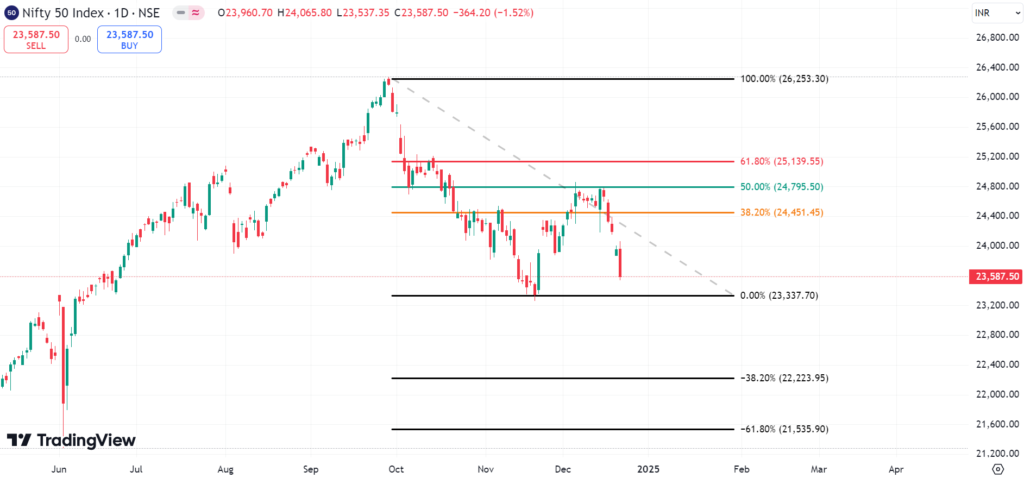
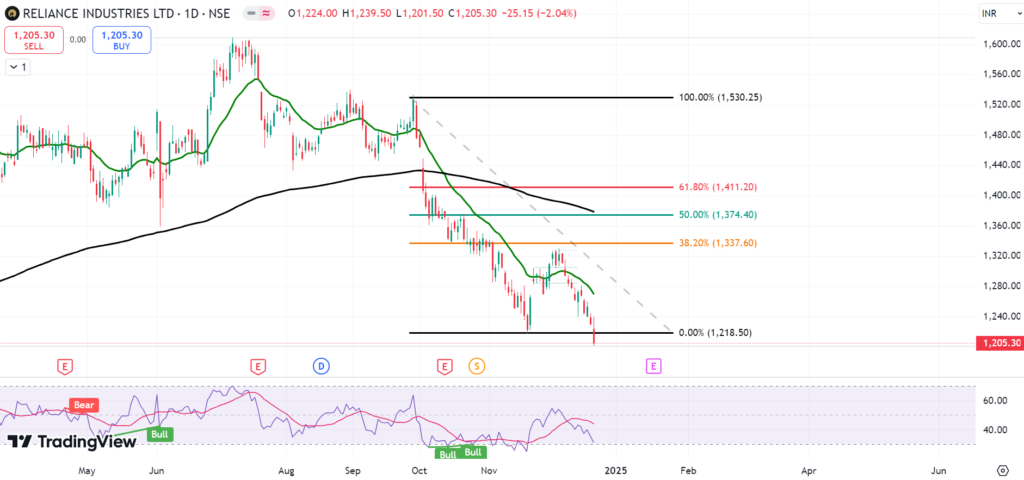
Fibonacci Retracements
What is Fibonacci Retracement? These are derived from the Fibonacci sequence, in which each number is the sum of the two preceding ones. 23.6%, 38.2%, 50%, 61.8%, 78.6% are the most popular retracement lines.
These are the percentage distance a price may retrace from its all time high or bottom. Traders identify a swing high and a swing low and then draw the retracement tool between them to start looking for Fibonacci retracements. For more information about Fibonacci Retracement you can visit https://nifty50trends.com/fibonacci-retracement-fibonacci-extension/
Fibonacci Retracement Levels Explained
- 23.6% Level: This level is a shallow retracement level and is typically seen in strong trends.
- 38.2%: A Level of moderate significance, provides strong support or resistance
- 50% Level: Not a “true” Fibonacci level, but a level that many use due to its psychological significance.
- 61.8% Level: This is the most important of all reversal levels, also known as the Golden Ratio.
- 78.6% Level: This level represents a deeper retracement, and it is often seen as a potential reversal zone.
How to Draw Fibonacci Retracement
Steps to draw Fibonacci retracement levels
- High swing high > swing low > Price movement.
- Most trading tools feature a Fibonacci retracement tool for this purpose.
- Join the swing high and low, and the erosive will be retracement levels.
- Watch the price response at these levels.

Fibonacci retracement levels should not be used in isolation, it works in conjunction with other technical analysis tools such as trend lines, moving averages or candlestick patterns. These levels are often used by traders to:
- Identify entry points on drawn downs.
- Determine possible stop-loss and take-profit levels.
- Verify the strength of a trend.
Predicting Nifty 50 & Stocks
Step 1: Analyze the Trend
- On Nifty 50 chart plot 20-day and 50-day EMAs.
- See we are compared if the short term EMA above or below the long term EMA
Step 2: Confirm with MACD
- The direction of trend can be confirmed by the MACD line crossover.
Step 3: Pinpoint Reversal Points
- Check if the market is overbought or oversold using the RSI
- Divergences: Pay attention to divergences between RSI and price movements
Step 4: Assess Volatility
- Look for breakout points using Bollinger Bands.
Step 5: Verify with Volume
- Use VWAP to tell if prices are above or below the average price.
- When you use these steps together, you will build a solid network of forecast for the Nifty 50.
Limitations of Technical Indicators
Technical indicators can be helpful, but not accurate. Here are some limitations:
- Lagging Information: The majority of indicators are based on past performance and, therefore, have the potential to trail behind actual market activity.
- Apart from that read: False Positives: In volatile markets, this indicator may give a false buy signal or a sell signal.
- Balance: Use Multiple Statistics: No single statistic is 100 percent accurate; combine several tools.
To make sure you avoid the pitfalls of the above shortcomings — always do fundamental analysis and best practices of risk management together with technical analysis.
Conclusion
Forecast Nifty 50 using technical indicators is an art and needs practice and strategy. Traders are able to gain insights into market trends through the use of tools such as moving averages, RSI, MACD, Bollinger Bands, Fibonacci retracements, and VWAP. But note that there’s no risk-free strategy. Always back test when possible and use proper risk management for capital preservation.
Keenly obtaining this coupled with disciplined execution over a course of time will lay very rock solid foundation block on which your Nifty 50 and other trading results will build.
“Share your predictions for today’s market in the comments below!”