Understanding support and resistance is critical to traders trading the stock market. This is critical for wise decisions and enhancing your trading success. In this guide, we will go over support and resistance. It’s designed to give you the insights and strategies to feel confident in the markets.
Support and resistance level is an important concept of technical support and resistance levels. And they provide traders with valuable insights into market psychology and participant behavior. By pinpointing these key price points, you can better understand market dynamics. This knowledge helps in making more strategic trading moves. These levels are known as support and resistance zones and are among the best price movement determinants that might help traders comprehend market trends more accurately. These are sound framework for predicting reversals and trends – irrespective of your level of experience.
This guide delves into support and resistance’s various facets. We consider what influences these price levels and advanced trading strategies that utilize them. Whether you are a seasoned trader or just starting, this article can provide you with the tools and insights you need. So that you can be a more successful and profitable trader in the stock market.
Key Takeaways
- Discover the fundamental principles of support and resistance in the stock market
- Learn to identify and analyze support and resistance levels using various technical analysis tools
- Explore advanced trading strategies that capitalize on breakouts, bounces, and multiple timeframe analysis
- Understand the psychology behind price levels and how it influences market behavior
- Gain insights to avoid common mistakes when trading with support and resistance
Understanding Support and Resistance Fundamentals
Trading revolves around grasping the price action and market psychology that shape markets. At its heart are support and resistance, key to market direction and entry/exit points.
What Are Support and Resistance Levels?
Support: A price level at which a downtrend is expected to pause due to a concentration of buying interest. In other words, this serves as a floor to stop the price from going lower. On the other hand, resistance is a price level that causes an uptrend to stop, as it is met with selling pressure. It acts as a resistance that stops the price from going up even more.
In simple terms:
- Support: It is a one of the areas that draw the support to the price floor
- Resistance: When price hits a ceiling and supply increases
These ranges or points do change but these zones is where the market puts in a lot of work before reversing or gathering strength.
What Creates Support and Resistance Zones
Support and resistance zones emerge from supply and demand interactions. When buyers are willing to buy the security at a specific price, a support zone is formed. Conversely, sellers want to sell at a price, where a resistance zone is formed.
The Psychology Behind Price Levels
The support and resistance levels here the psychological factor plays an important in creating highs and lows. * Humans (Traders and Investors) * Traders act in accordance with their past experiences, gut feelings and biases. A price level that has a track record of serving as excellent support or resistance is therefore even more important in terms of market psychology.
Types of Support and Resistance
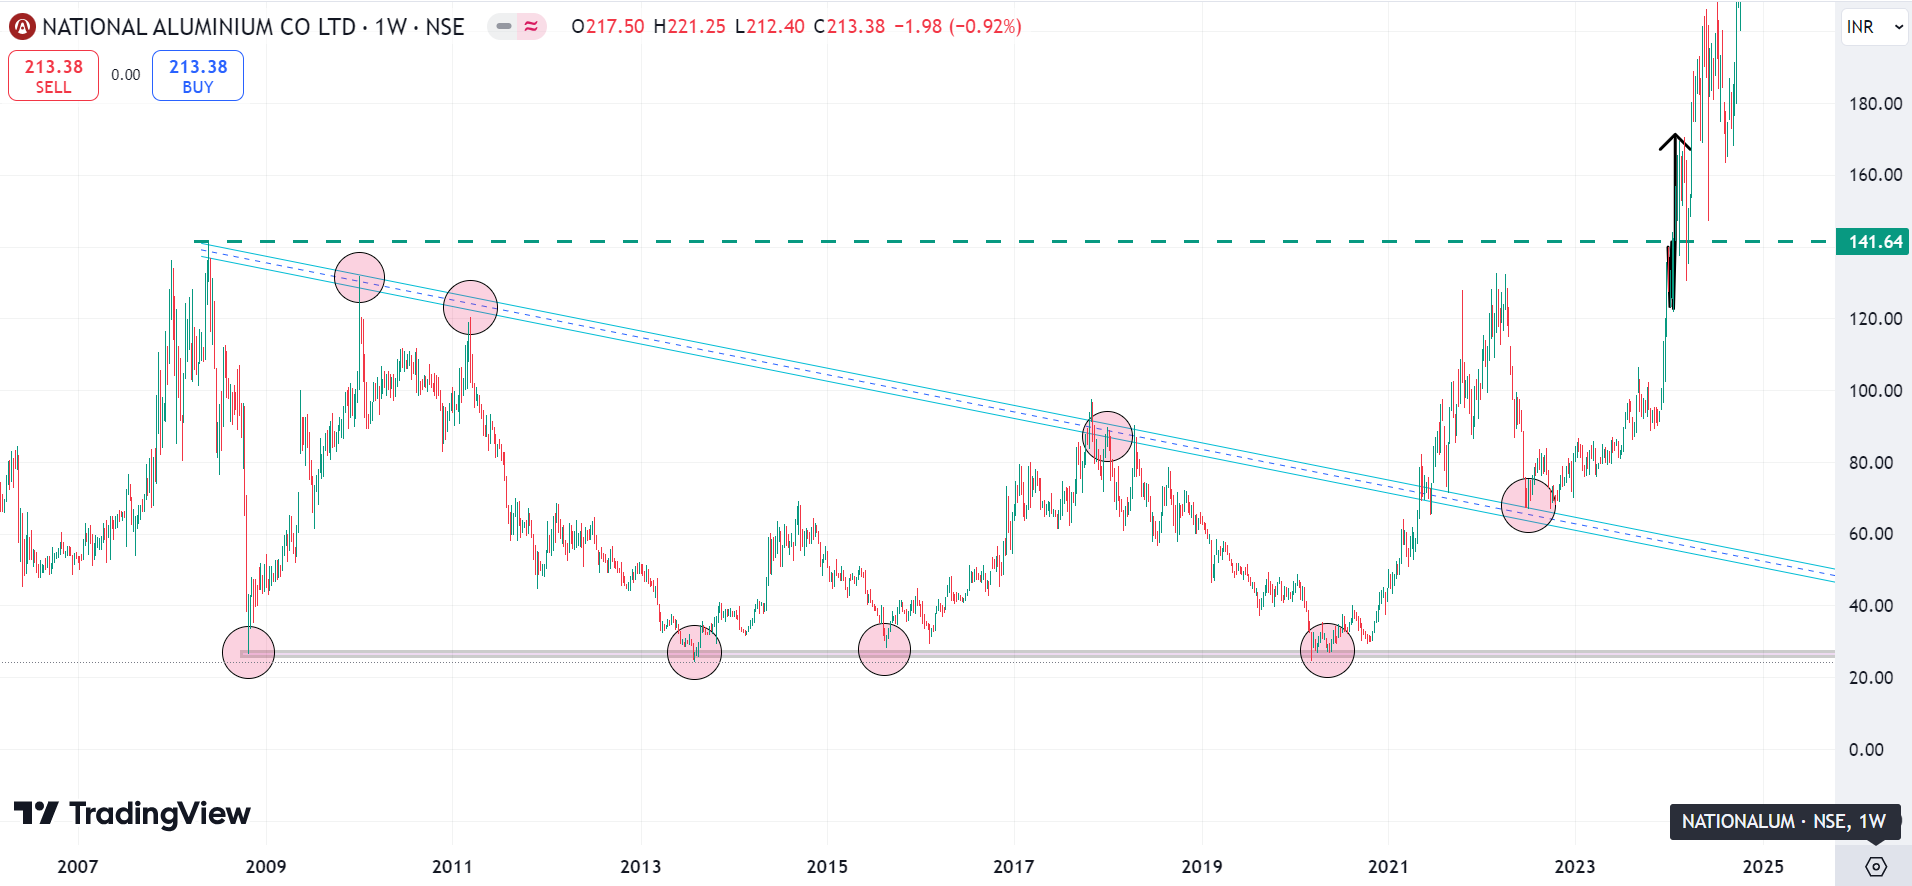
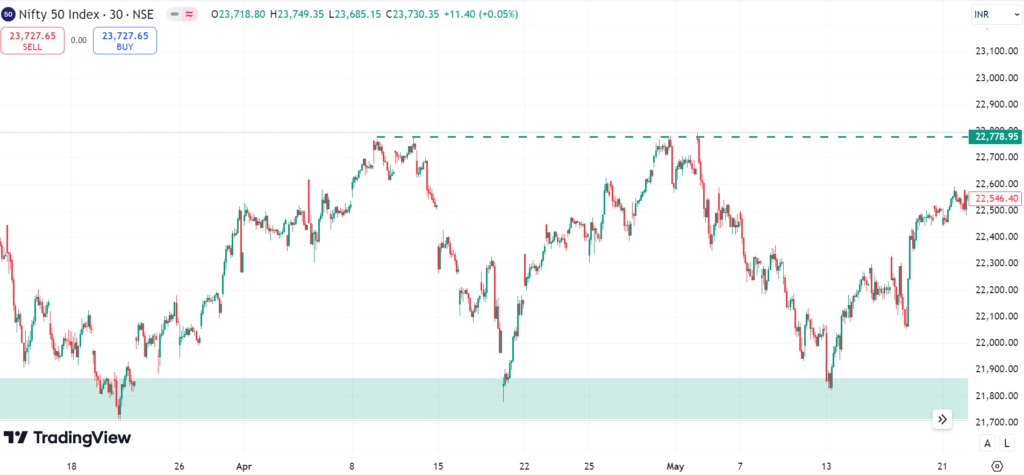
Horizontal Support and Resistance: The most classic, built at price levels where price has historically acted as support/resistance and the market has bounced/been rejected in the past.
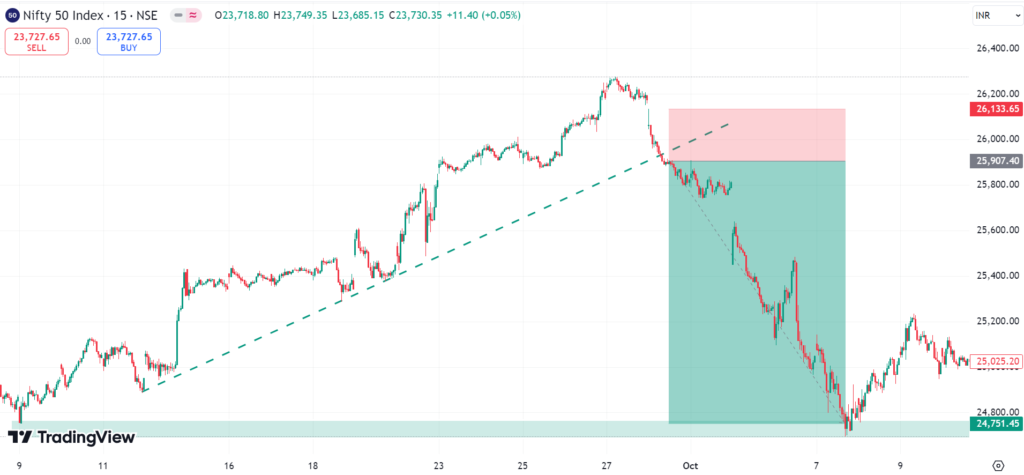
Trend lines: These are dynamic support and resistance levels created by connecting peaks and troughs of a price trend that show the general direction of the market.
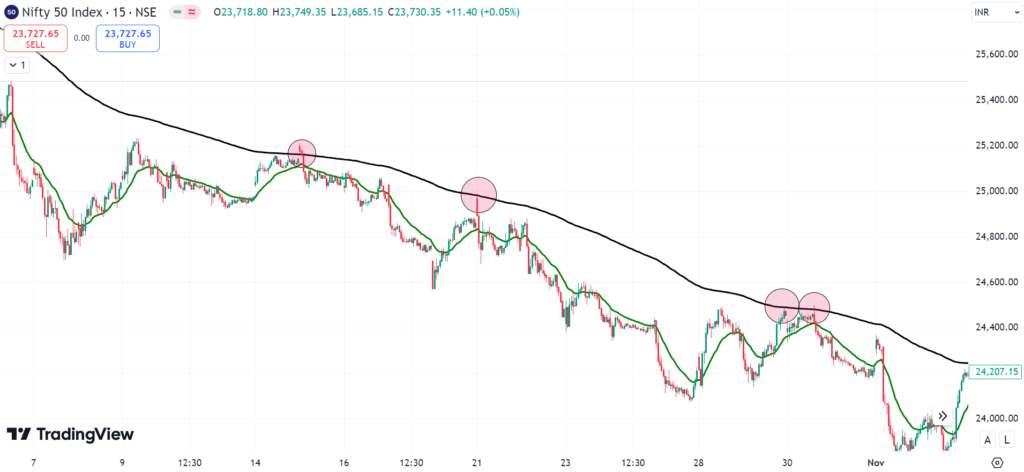
Dynamic Support and Resistance: These levels are more flexible and changeable, typically set by moving averages or other technical indicators that adjust in line with the market’s price movement.
Understanding the different types of support and resistance, as well as what creates them, is one of the building blocks of a good trading strategy. This helps traders take actionable decisions in the markets.
What does Support and Resistance really tell you?
Identifying support and resistance levels is key for traders aiming to outperform. These price points are crucial for making informed trading decisions and managing risk. We’ll delve into practical methods to spot these levels, combining chart patterns, technical indicators, price action, volume analysis, and market structure.
Historical price data analysis is a primary method to identify these levels. Look for areas where prices have bounced or been rejected, indicating significant support or resistance. Chart patterns, such as trendlines and channels, also help pinpoint these critical points.
Best Indicator for Support and Resistance
Technical indicators, like moving averages, offer insights into potential support and resistance areas. Price interactions with these indicators signal important levels to monitor. Volume analysis, when combined with price action, further confirms the significance of these levels. For more information about indicators you can visit https://nifty50trends.com/technical-analysis/
Lastly, understanding the market structure is vital. The broader trend, structural levels, and larger market participants’ behavior influence these critical price points. Utilizing these can help you establish major support and resistance levels, ultimately leading to better trading decisions.
Use these methods to find support and resistance levels. This lays the foundation for better-informed and more profitable trading decisions.
“Trading well is all about finding the most relevant support and resistance levels in the price.
Advanced Trading Strategies Using Support and Resistance
As an experienced trader, you can unlock the true potential of support and resistance levels by implementing advanced trading strategies. These techniques go beyond the basic principles. They empower you to navigate the markets with greater precision and profitability.
Breakout Trading Techniques
It can indicate a powerful magnification of market sentiment when prices break established support and resistance levels. So learning how to trade breakouts enables you to profit from these energetic price swings. Tracking false breakouts and trend reversals allows you to spot high-probability levels of entry and exit while taking on less risk.
Bounce Trading Methods
Bounce trading works best in range bound markets, where prices range between a defined trading range. You want to trade the “bounces” within this range, so by predicting the “turning points” at the support and resistance levels, you can open a trade. The key to this methodology is an understanding of market psychology and identifying levels of market action with impunity.
Multiple Timeframe Analysis
Traders who are successful know that support and resistance must be analyzed across multiple time frames. It allows you to validate setups, locate potential areas of conflict, and make better decisions. Using various time frames will improve your trade strategy as well as your risk management.
| Trading Strategy | Description | Key Considerations |
| Breakout Trading | Capitalizing on price movements beyond established support or resistance levels | Identifying false breakouts, managing risk, and capturing trend reversals |
| Bounce Trading | Executing trades within a defined trading range, riding the “bounces” at support and resistance | Understanding market psychology, pinpointing key levels, and timing entries and exits |
| Multiple Timeframe Analysis | Analyzing support and resistance across different time frames to confirm trade setups and manage risk | Identifying potential areas of conflict, aligning trade decisions with the broader market context |
With these advanced strategies in your arsenal, you can now unlock new opportunities and navigate the markets with greater confidence. After all, most likely your success is heavily dependent on how you systematically adapt the ceil or floor rule and adjust it hand in hand throughout your support and resistance trading. For option chain data which provides support and resistance levels according to OI you can visit https://www.nseindia.com/option-chain
How to Draw Support and Resistance Lines
They may need more practice and they tend not to pay attention to details. Here’s a guide to help you get started, step by step:
Identify Key Price Levels
Identify chart regions where the price has reversed many times. These are considered important levels of support and resistance.
Use Multiple Timeframes
For more range consider support and resistance on different timeframes. For example, a significant level on a daily timeframe may not be the same on an hourly timeframe.
Draw Horizontal Lines
Now that you are aware of the key levels, draw horizontal lines over these points. Have them confirm with several price reactions to make them reliable.
Incorporate Trendlines
In trending markets, trendlines can also serve as support and resistance levels; trendlines are diagonal lines created by joining higher lows (support) or lower highs (resistance).
Use Technical Indicators
Support and resistance analysis can be supplemented by indicators such as pivot points, Fibonacci retracement and moving averages to help pinpoint potential levels.
Common Mistakes to Avoid When Trading Support and Resistance
Ignoring False Breakouts
Not every breakout is the real McCoy. Validate the breakouts or other signals with other indicators to avoid false signals.
Overloading Charts
The more support and resistance lines you draw on your chart, the more confused you will get. Keep that focus: Relevant levels vs price action.
Neglecting Timeframes
So relying solely on one timeframe may result in incorrect conclusions. Check all the levels from outside time frames.
Failing to Adjust Levels
Support and resistance levels move and can change over time. Keep your analysis updated with the market
| Mistake | Description | Impact |
| Overtrading | Relying too heavily on support and resistance levels without considering market context | Unnecessary losses and poor trading performance |
| Ignoring context | Disregarding the interaction of support and resistance with other technical indicators, news events, and market sentiment | Missed opportunities and ill-timed trades |
| Neglecting confirmation | Relying solely on a single support or resistance level without seeking corroborating signals from other indicators | False breakouts and erratic trading decisions |
| Emotional trading | Allowing fear, greed, or other emotions to override a disciplined trading plan | Sabotaged trading performance and suboptimal decision-making |
| Risk management errors | Inadequate stop-loss placement or position sizing | Amplified consequences of losses and impaired trading capital |
“Mastering the art of support and resistance trading requires both technical proficiency and emotional discipline. Avoid these common pitfalls to unlock your full trading potential.”
Real-Life Applications of Support and Resistance
Case Study: Nifty50
For example, popular index — Nifty50 — in the Indian stock market. Let’s say Nifty50 has a good support level at 18,000 and resistance at 18,500. The index swings between these levels over the course of weeks.
(More on Bounce trade as well, Buy around 18000 with Stoploss of 17950 & Sell around 18500)
Breakout opportunity: traders, go long in Nifty50 if it breaks the levels of 18,500 with volume, target for next resistance, 19,000.
The example reflects on how one can go forward with his trading decision with the help of Support and resistance.
Conclusion
However, there is also the art of support and resistance in stock trading, the secret weapon, they can shoot your trading to new highs. Allow us to show you how to draw these levels, step in and use functional trading and the common mistakes that you can stop doing when trading these levels to improve your overall trading.
Whether you day trade, swing trade or invest long-term, one thing will always work for you on the market and these are SP levels of support and resistance. These are fundamentals of technical analysis, and they must not be ignored, for they will make your gaming in the markets successful with practice and discipline.
FAQ
What creates support and resistance zones in the stock market?
Supply and Demand: Support and Resistance Zones are Created from Supply and Demand Interaction The fair value of a security is set by buyers and sellers. The levels are predicated on historical price points, market psychology, and trader behavior.
How can I identify support and resistance levels in the stock market?
Identifying support and resistance levels involves analyzing historical price data and recognizing chart patterns. Technical indicators also help. It’s crucial to verify these levels across different timeframes and consider trading volume for more accurate analysis.
What are some advanced trading strategies that use support and resistance?
Advanced strategies focus on breakout trading, bounce trading and multi-time frame trading. These techniques enable you to profit from price trends above these levels. They assist in risk management and better trading decisions.
What are some common mistakes to avoid when trading with support and resistance?
Avoid overtrading based on weak levels and ignore market context. Don’t fail to seek confirmation from other indicators. Letting emotions override your trading plan is also a mistake. Being aware of these pitfalls can improve your trading performance.
How can I integrate support and resistance analysis into my trading plan?
To integrate support and resistance analysis, continuously learn and adapt your strategies. Understand the fundamentals, identify reliable levels, and apply advanced techniques. This approach enhances your trading performance and decision-making.