Skip to content
Nifty50Trends
  • Home
  • Market Insight
    • Technical Indicators
    • Pre-Market Analysis
  • Tools
    • Option Premium Calculator
    • SIP Calculator
    • Risk Management Tool

Nifty50Trends

  • Home
  • Market Insight
    • Technical Indicators
    • Pre-Market Analysis
  • Tools
    • Option Premium Calculator
    • SIP Calculator
    • Risk Management Tool

Technical Indicators

Welcome to the Technical Analysis section of our blog, where we delve into the art and science of analyzing price movements and patterns in the stock market. This category is for traders and investors who want to learn about market trends more, which potential trading opportunities to focus on, and how to make better decisions with technical tools

Here, you’ll find in-depth articles, tutorials, and guides on essential concepts such as:

  • Chart patterns: Identifying formations such as head and shoulders, triangles, and double tops.
  • Technical Indicators and Oscillators: Familiarizing with tools such as moving averages, RSI, MACD etc.
  • Trend Following: How to Interpret and Capture trends.
  • Support and Resistance: Learning to identify price levels at which markets seem to reverse or consolidate.

Our posts are designed to deliver actionable insights and pragmatic knowledge catering to both novice and seasoned traders in the Indian stock market and beyond.

The information on this site is for informational purposes only and should not be considered financial advice. Investing in stocks carries risks, and past performance isn’t indicative of future results. We offer no guarantee this data or analysis is accurate or complete. So use this at your own risk

exponential moving average

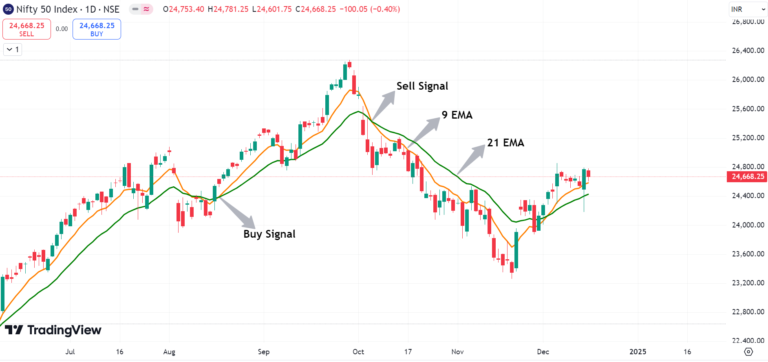
Exponential Moving Average (EMA): Master 3 Powerful Trading Strategies

January 1, 2025December 17, 2024 by Aditya

What is EMA, Exponential Moving Average, EMA Crossover Strategy, Best EMA for Intraday Trading, EMA Strategy for Beginners, 200 EMA …

Read more

moving average convergence divergence

Moving Average Convergence Divergence (MACD): The Ultimate Trading Guide

January 1, 2025December 13, 2024 by Aditya

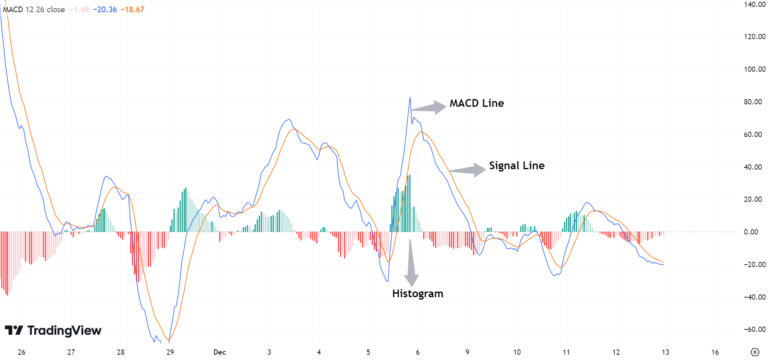
Moving Average Convergence Divergence (MACD), How to use MACD in Trading, MACD Strategy for Beginners, Advanced MACD Strategies, Types of …

Read more

relative strength index

Relative Strength Index (RSI): Learn 3 Powerful RSI Strategy for Nifty 50

January 7, 2025December 7, 2024 by Aditya

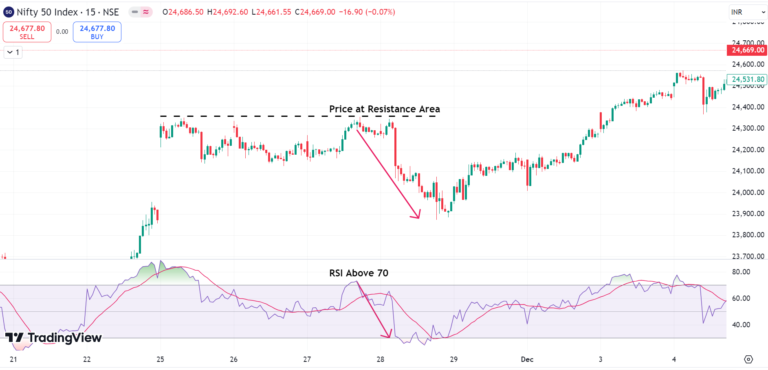
What is Relative Strength Index and how is RSI calculated, Interpreting RSI Values, RSI Trading strategies with example, Divergence in …

Read more

Newer posts
← Previous Page1 Page2

Choose Your Category

  • Market Insight (10)
  • Pre Market Analysis (5)
  • Technical Indicators (13)

Popular Post

  • budget 2025
    Budget 2025: Expert Analysis on Stock Market Impact You Can’t Ignore
  • ichimoku cloud strategy for nifty 50
    Ichimoku Cloud Strategy for Nifty 50 Trading
  • Will Indian Stock Market Crash in January 2025
    Will Indian Stock Market Crash in January 2025
  • bajaj housing finance
    Bajaj Housing Finance: Navigating the Share Price Landscape
  • unimech aerospace
    Unimech Aerospace: IPO Success and Share Price Analysis
  • ADX
    How to Master the ADX Indicator for Better Trading Decisions
  • option chain
    Option Chain Analysis: A Comprehensive Guide to Smarter Trading
  • Home
  • Contact Us
  • About Us
  • Disclaimer
  • Privacy Policy
  • DMCA
Copyright © 2025 - Nifty50Trends